.png)
Subscribe
As large language models (LLMs) become embedded in apps across customer service, product support, and digital experiences, one question still remains unanswered: how do you know your AI is performing well?
It’s easy to measure activity such as tokens used, response times, and completion rates. But it’s a lot harder to measure experience. Are users getting accurate, helpful responses from the AI? Is the model aligned with your brand, policy, and customer satisfaction goals? This is where LLM Analytics fills in the gaps.
In this blog, we’ll walk through how LLM Analytics improves AI performance by combining traditional observability metrics with deeper experiential analysis. We’ll break down the metrics you should care about and showcase a real-world example on how businesses can close the loop between model behavior and business goals.
What Are LLM Analytics?
LLM Analytics refers to the process of tracking, analyzing, and improving the performance of large language models used in AI applications. These analytics can be applied to AI agents, chatbots, customer support tools, internal copilots, or any use case where LLMs engage users in natural language.
Most teams today monitor surface-level metrics like latency, token counts, and conversation volume. While these observability metrics are useful, they don’t reveal whether the LLM is actually providing accurate, helpful, or brand-aligned experiences.
LLM Analytics bridges that gap by combining experiential insights with traditional LLM monitoring. It turns opaque conversations into structured data and provides a framework to evaluate what the model said, why it said it, and what impact it had for the user.
Why AI Teams Need LLM Analytics
LLMs are powerful but unpredictable. They can hallucinate, drift from training data, respond off-brand, fall into loops, and fail to resolve issues. Left unchecked, these behaviors lead to:
- Poor customer experiences
- Increased escalations and agent handoffs
- Regulatory and compliance risks
- Brand trust erosion
LLM Analytics gives product and AI teams the ability to:
- Diagnose problems quickly
- Prevent model hallucinations
- Quantify helpfulness, customer effort, and sentiment
- Identify common conversation patterns and friction points
- Set up guardrails and workflows to fix issues
By combining observability and experiential analysis, you can move from the AI black box towards proactive LLM optimization.
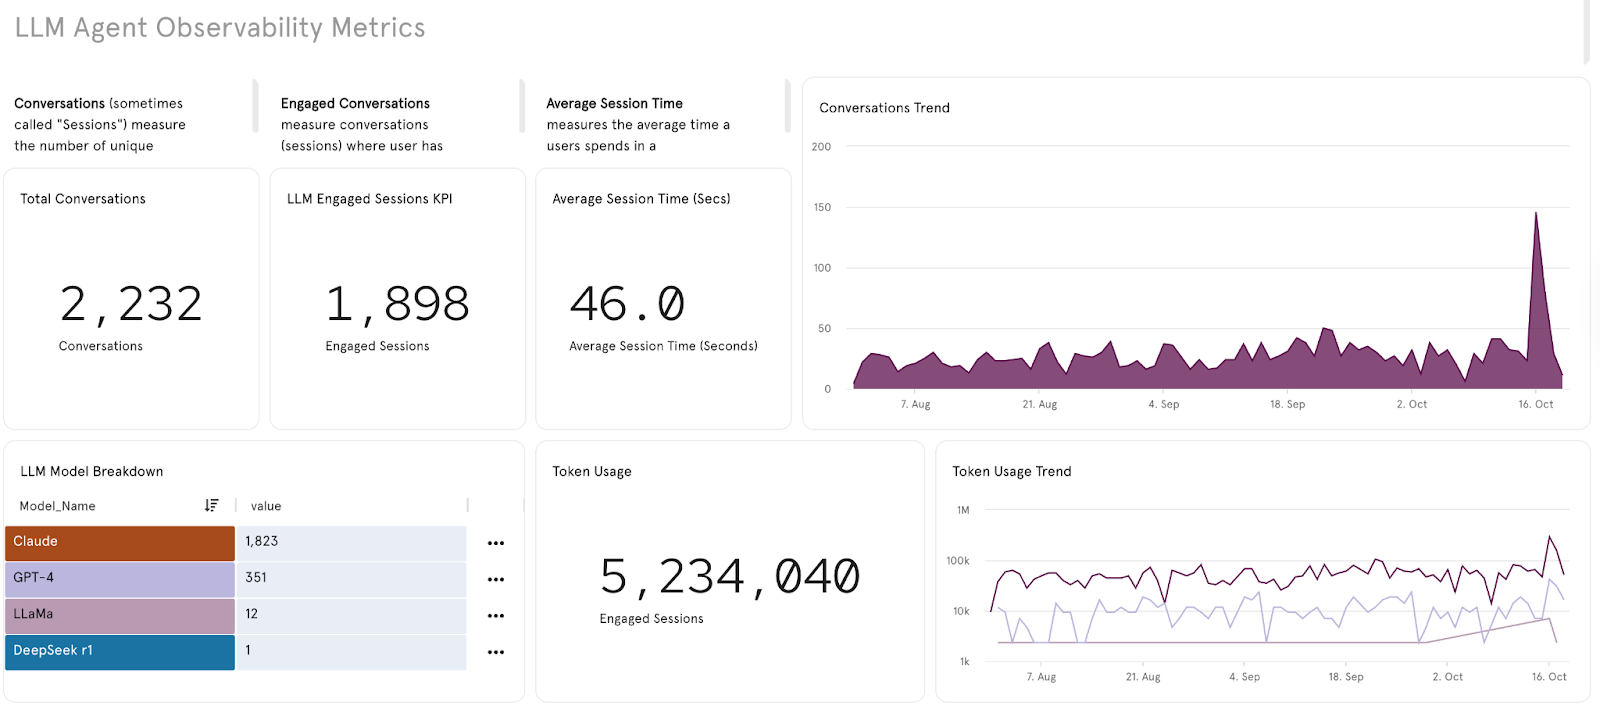
Observability Metrics: Basic LLM Monitoring
Most AI teams already track basic observability metrics, which serve as the foundation for performance monitoring. These typically include:
- Total Conversations: How many sessions are your LLMs handling?
- Engagement Rate: What percentage of sessions include meaningful interaction?
- Token Usage: How many tokens are being consumed, and by which models?
- Average Session Duration: How long are users engaging with the model?
These metrics help answer questions like:
- Are we scaling costs efficiently?
- Which models are cost-effective?
- Is usage trending up or down?
But they don’t answer the most important question: Is the LLM doing a good job?
That’s where experiential analytics comes in.
Experiential Metrics: Measuring LLM Quality
At Dimension Labs, we believe the true value of LLM Analytics lies in experiential metrics. These are indicators of conversation quality, customer satisfaction, and LLM brand alignment. We base our analysis in the data coming from your customers interacting with the LLM.
Our platform introduces a four-tier framework called the AI Health Score, which combines:
- Completion Score – Did the model successfully complete or resolve the user’s request?
- Sentiment Score – What emotional tone emerged in the conversation?
- Helpfulness Score – Did the user find the model’s responses useful?
- Effort Score – How hard did the user have to work to get a good outcome?
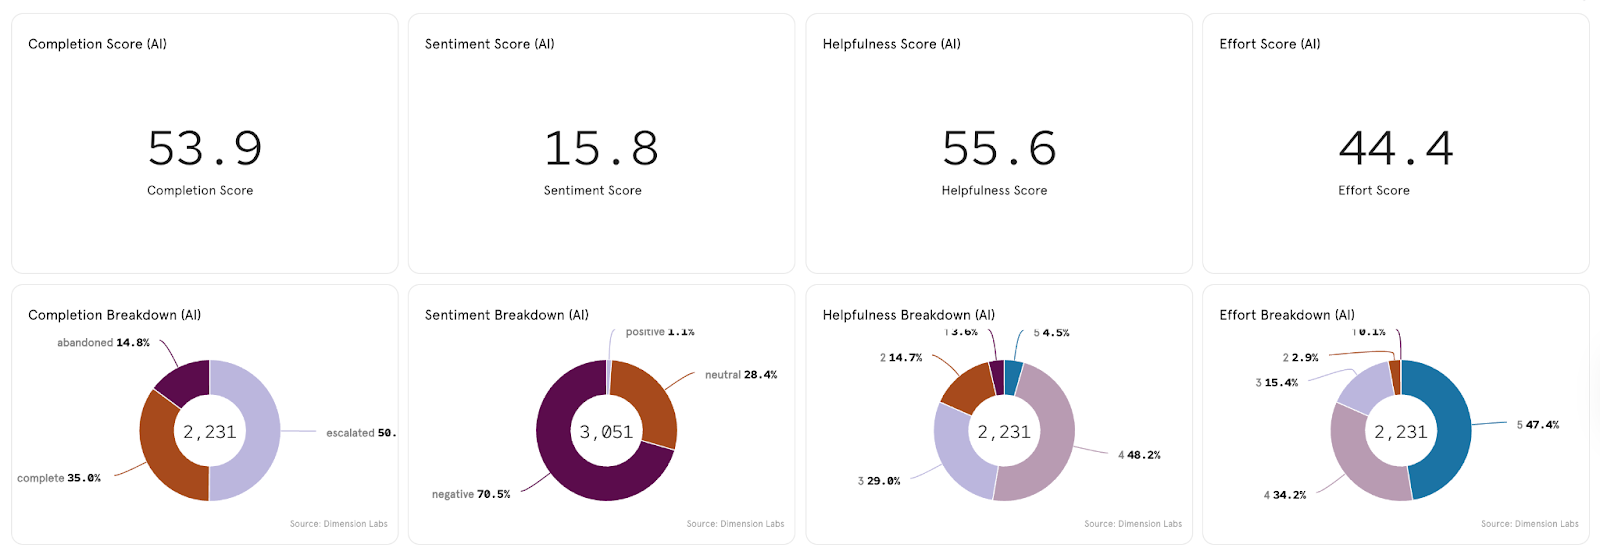
These scores can be combined into a single health index or analyzed independently. They offer a more comprehensive view of performance, surfacing conversations that may look fine on the surface but fail to meet user expectations.
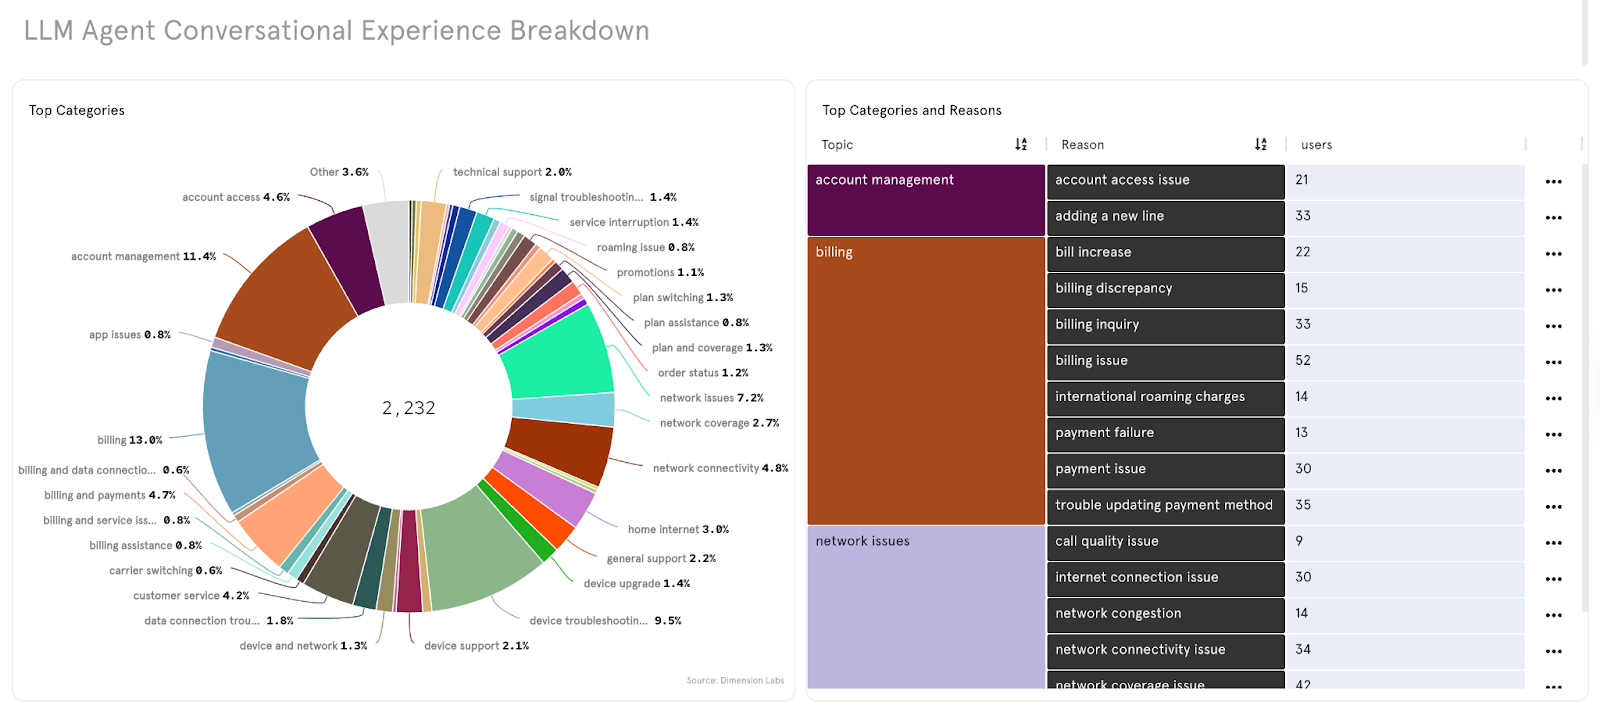
Real Example: LLM Support Agent for a Fortune 500 Telco Provider
Let’s look at an AI agent deployed by a large telco company. Observability metrics showed high session volume, stable latency, and moderate escalation rates. But the AI Health Score told a different story: only 40.4 out of 100, signaling serious experiential issues.
Diving into the dashboard, we found:
- Frequent hallucinations, with the bot making up company policies
- Off-brand responses like “Maybe you should switch providers”
- High user effort in resolving billing issues
- Inconsistent escalation behavior
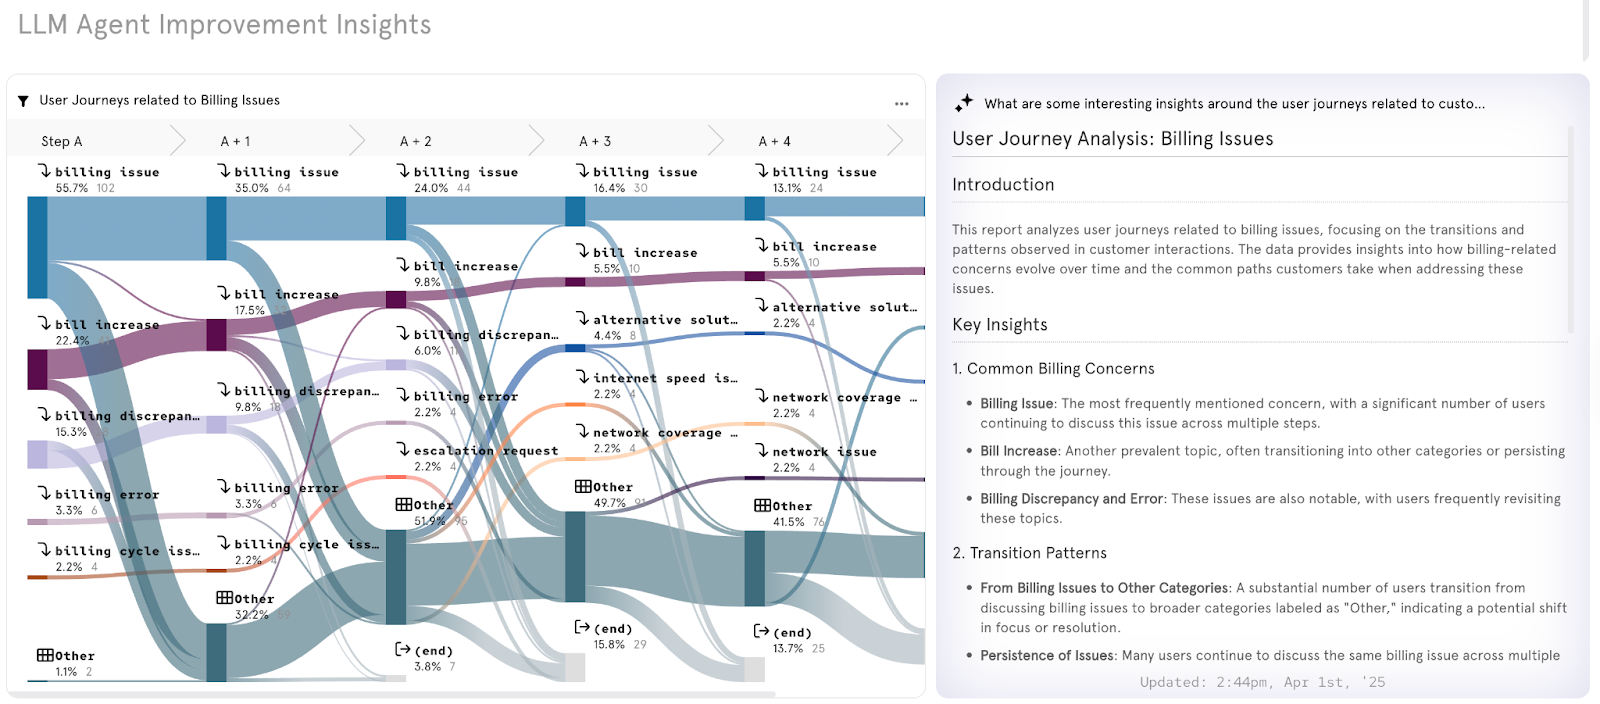
By visualizing dissatisfaction drivers and mapping conversation flows, the team could now:
- Identify where drop-offs occurred in billing conversations
- Spot overly creative responses tied to high temperature settings
- Add guardrails and fallback responses to prevent brand damage
- Update knowledge base content to improve helpfulness
In one case, the bot replied to a customer with, “As an overworked representative, there’s nothing more I can do,” revealing a major oversight in fine-tuning and response filtering.
With experiential LLM Analytics, these red flags become visible and actionable.
Using Visual Insights and Semantic Mapping
Experiential analytics also includes tools for semantic mapping. In our example, the telco team used a heatmap to visualize which types of issues the LLM handled best vs. where it struggled. Clusters of conversations were grouped by intent, outcome, and emotional tone—revealing latent issues no one had seen before.
Another key feature used was AI Cards: dynamic summary cards that automatically extract top insights from conversation clusters and recommend specific fixes.
These include:
- Adjusting model temperature
- Rewriting flawed responses
- Adding escalation triggers
- Updating training data
This new level of detail allows teams to spot problems and understand why they’re happening and how to fix them.
Who Should Use LLM Analytics?
LLM Analytics are essential for any organization deploying AI agents and apps, especially if they’re customer-facing. Teams we’re seeing adopt LLM analytics include:
- Product and Engineering Teams managing chatbots, support agents, or internal copilots
- CX and Contact Center Leaders focused on support quality, costs, and KPIs
- Data and ML Teams overseeing model accuracy, training, and governance
Even marketing, quality assurance, and operations teams can benefit by understanding how AI is interacting with customers and representing the brand.
If you’re scaling AI across departments or digital channels, LLM Analytics becomes the system of record for model behavior and performance.
Driving AI Improvement with LLM Analytics
The ultimate value of LLM Analytics is not just diagnosis—it’s action. After deploying LLM Analytics, they quickly become the engine for closed-loop feedback and fuel real-time improvements to your organization’s AI and AI-assisted apps.
With LLM Analytics you can:
- Detect and resolve customer issues before they escalate
- Continuously retrain your model based on historical conversation data
- Optimize for CSAT, cost, and compliance in parallel
- Provide visibility across teams into what the AI is doing and why
This is how organizations move from launching an LLM agent to truly operationalizing it. You’re no longer reacting to failures of the model, you’re proactively working on improving the performance.
At Dimension Labs, we help companies do exactly that. Our platform unifies observability and experiential metrics to give you full visibility into LLM behavior, performance, and customer impact.
Want to see it in action with your own data? Reach out to Dimension Labs to request a demo today.
Frequently Asked Questions (FAQs)
1. What are LLM Analytics?
LLM Analytics refers to the process of tracking, measuring, and optimizing the performance of large language models (LLMs) such as ChatGPT or Claude. It helps teams understand how LLMs and AI Agents built on LLMs behave, respond to users, and impact the user experience.
2. Why are LLM Analytics important?
LLM Analytics helps businesses improve performance of AI applications, reduce hallucinations and inappropriate messages, and increase customer experience and satisfaction. It provides visibility into model behavior and conversation quality at scale.
3. What metrics are used in LLM Analytics?
Common LLM Analytics metrics include token usage, response time, user sentiment, intent accuracy, customer effort, and CSAT (customer satisfaction). These help teams assess the LLM’s effectiveness and optimize it.
4. Who should use LLM Analytics?
Product managers, data scientists, and engineering teams use LLM Analytics to monitor and improve chatbots, AI agent, and assistant performance. It’s especially useful for companies deploying AI in customer-facing applications such as support or sales.


